Proposal: Export Control Path Network Metrics
Author(s): @waqaraqeel
Last updated: 07/13/2021
Discussion at https://github.com/magma/magma/issues/8028.
Context & scope
Services running on the access gateway communicate with the orc8r and generate control traffic. We do not have visibility into the amount, patterns, and service-level breakdown of this traffic. As we try to minimize control plane bandwidth consumption for our deployment partners, especially those with satellite backhaul, visibility into bandwidth consumption is crucial. This proposal details a design for collecting and exporting control plane network metrics from the access gateway to the orchestrator and NMS.
See Life of a Magma Metric for context on existing Magma metrics pipeline.
Goals
-
On the access gateway, record byte counts grouped by AGW source service and destination cloud service. For non-Magma traffic, only record the Linux binary that sends traffic.
-
Export byte counts as Prometheus metrics on the NMS UI.
-
Minimize performance penalty on the gateway for network metrics collection.
-
Minimize required infrastructure changes for metrics export and for deployment.
Non-goals
- Change collection/export methods for existing data-path metrics.
Proposal
To collect relevant byte count metrics, we propose using an eBPF program. eBPF is a modern Linux kernel feature that allows running sandboxed programs inside the kernel without having to change kernel source code or loading privileged/risky kernel modules. The Linux kernel verifies eBPF programs to ensure safety and termination, and provide certain performance guarantees [1].
We will use the BCC toolkit for writing and loading our eBPF monitoring program. BCC makes it easier to write eBPF programs by providing clean abstractions for kernel instrumentation, and Python and Lua libraries for writing user space front-end programs that communicate with the kernel space eBPF program. We will write a Python front-end since many of our existing services already use Python, and we have convenient infrastructure for exporting Prometheus metrics from Python services.
We will create a new Python service called kernsnoopd (not netsnoopd as this
service can later become a home for more observability through eBPF). Upon
service start, kernsnoopd will compile the eBPF kernel instrumentation program
and load it. It will read collect_interval from its configuration. Every
collect_interval seconds, kernsnoopd will read the counters from the eBPF
program into Prometheus counters and clear the eBPF counters.
The byte counts read from eBPF will be stored into Prometheus counters
magma_bytes_sent_total and linux_bytes_sent_total. The
magma_bytes_sent_total counter will have the label service_name indicating
AGW source service, and dest_service indicating the cloud destination service.
The linux_bytes_sent_total counter will only have a binary_name label. On
the loopback interface, only the port on which control_proxy is listening for
traffic will be observed. This port and other information related to Magma
services can be read from the
ServiceRegistry.
On other interfaces (see Open Issues), all traffic will be
observed. task->comm from the kernel will be used to identify the binary
triggering traffic. In case of Python services, the binary name is python3 so
command line arguments (e.g. magma.main.subscriberdb) will be used to infer
the source service name.
All traffic from the AGW to the Orc8r will be going to
the same destination port, so we may have to look at the HTTP authority
header
to infer destination service.
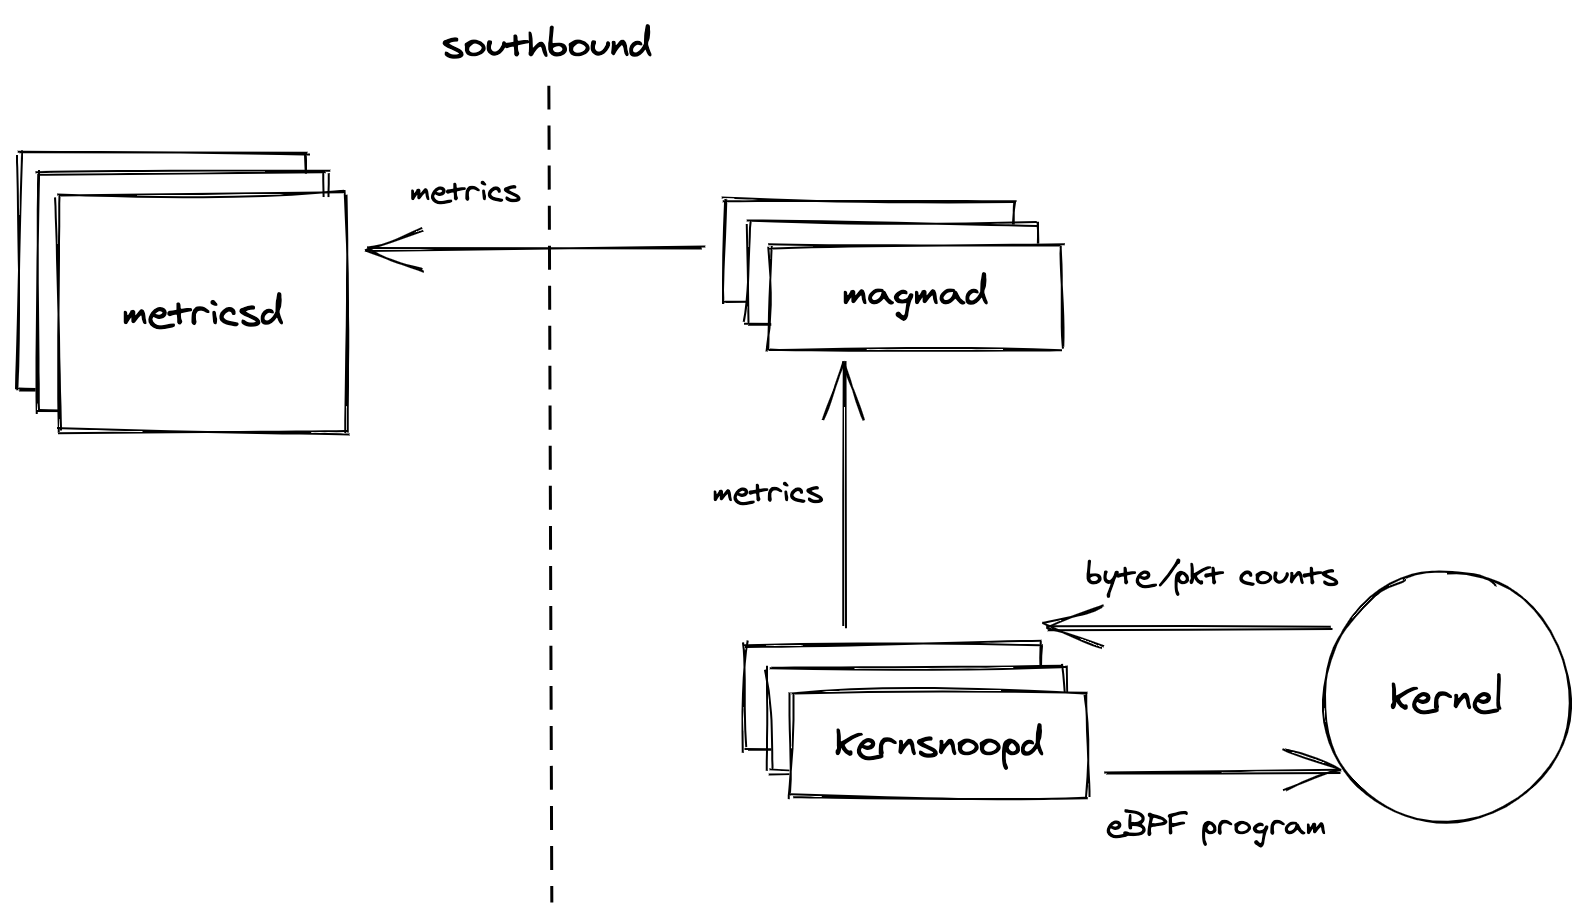
Once Prometheus counter values have been set, they will follow the existing
Magma metrics path: the magmad service will read the counters from
kernsnoopd and upload them to metricsd at the orchestrator every
sync_interval seconds. The NMS UI will then display these metrics. The Life
of a Magma Metric document describes this path in
detail.
This design achieves goals #1 and #2. The choice of eBPF minimizes performance penalty (discussed here) by putting compiled code into the kernel and avoiding raw packet captures. We also utilize the existing metrics plumbing for Python services.
Now we show a prototype of the eBPF program kernsnoopd will use:
#include <bcc/proto.h>
#include <linux/sched.h>
#include <uapi/linux/ptrace.h>
#include <net/sock.h>

struct key_t {
  // binary name (task->comm in the kernel)
  char comm[TASK_COMM_LEN];
  u32 pid;
  // source port and destination IP address, port
  u32 daddr;
  u16 dport;
};

// Create a hash map with `key_t` as key type and u64 as value type
BPF_HASH(dest_counters, struct key_t);

// Attach kprobe for the `tcp_sendmsg` syscall
int kprobe__tcp_sendmsg(struct pt_regs *ctx, struct sock *sk, struct msghdr *msg, size_t size) {
  u16 dport = 0, family = sk->__sk_common.skc_family;

  // only IPv4
  if (family == AF_INET) {
    struct key_t key;

    // read binary name, pid, source and destination IP address and port
    bpf_get_current_comm(key.comm, TASK_COMM_LEN);
    key.pid = bpf_get_current_pid_tgid() >> 32;;
    key.daddr = sk->__sk_common.skc_daddr;
    dport = sk->__sk_common.skc_dport;
    key.dport = ntohs(dport);

    // increment the counters
    dest_counters.increment(key, size);
  }
  return 0;
}
This program is written in restricted C (prevents direct memory access, for
example) that is suitable for LLVM compilation into BPF bytecode. It uses macros
from BCC to create a hash map data structure (dest_counters), and attach a
kprobe to the
tcp_sendmsg
function. This probe gets triggered just before a TCP segment transmission. Our
callback function reads the appropriate context and increments relevant counters
in the hash map.
Below is an example of a front-end Python program that retrieves and displays the counters aggregated in the kernel:
import time

from bcc import BPF
from socket import inet_ntop, ntohs, AF_INET
from struct import pack

INTERVAL = 3
TASK_COMM_LEN = 16 # linux/sched.h

def print_table(table):
    print("----------------------------")
    for k, v in table.items():
        daddr = inet_ntop(AF_INET, pack("I", k.daddr))
        dport = ntohs(k.dport)
        print(f"{k.pid} sent {v.value} bytes to ({daddr}:{dport})")
    print("----------------------------")

if __name__ == "__main__":
    # compile and load eBPF program from source file
    b = BPF(src_file="transmit_trace.c")

    # print and clear table every INTERVAL seconds
    while True:
        time.sleep(INTERVAL)
        table = b["dest_counters"]
        print_table(b["dest_counters"])
        table.clear()
A Python-free Future
If/when we move to a Python-free AGW, the design above can be modified depending upon which language we choose to adopt.
If we choose Go, we do not have to change the eBPF program written in
restricted C as Go bindings for BCC are available in the
gobpf package. This package also provides
low-level routines to load eBPF programs from .elf files, so we can send
compiled programs to the AGW and remove clang as a dependency. However, programs
would presumably have to be compiled for various kernel versions. Pre-compiling
is not necessary though as gobf allows the front-end Go program to trigger
compilation just like the Python program above does.
If we choose C/C++, we should consider switching from BCC to
libbpf. While BCC provides C bindings to
write front-end programs, libbpf is a simpler alternative. This means
the libbpf API is not as convenient, but it supports compiling both the eBPF
program, and the front-end program into a small binary and remove clang as a
dependency on the AGW.
We have tools to translate Prometheus metrics for consumption at the magmad
service in the AGW for both Python and C/C++. Such tools don't exist in Go, but
writing those tools will presumably be part of the plan to replace Python on the
AGW with Go.
Alternatives considered
Here, we enumerate alternatives to the above design that we considered:
-
libpcap: There are several existing monitoring tools based onlibpcapsuch as Nethogs and iftop. While these tools do not collect the exact metrics required, it should be straightforward to modify them or write a new tool based onlibpcap. The larger issue is thatlibpcapwill make a copy of the packet fromskbuffto a shared buffer in the kernel, which incurs significant overhead. Moreover, we do not see any advantages oflibpcapover eBPF. -
nghttpx: We usecontrol_proxyto proxy TLS connections from individual services to the orchestrator. However,nghttpx, the proxy implementation we use does not collect per-service byte counters.nghttpxcould probably be modified to collect these statistics, but that would probably be higher development effort and may yield worse performance. Also, it will not work ifproxy_cloud_connectionsis set toFalseand services are connecting to the cloud directly. Even ifproxy_cloud_connectionsis set toTrue,nghttpxwill not be able to capture general traffic outside of Magma daemons. -
cilium/epbf: This is a pure Go eBPF library alternative to BCC.cilium/ebpfhas minimal external dependencies and delivers a single binary that will contain the eBPF program, its loader and the front-end to communicate with it. It provides abpf2gotool which compiles an eBPF program written in C and generates a Go file containing the compiled bytecode. The API is less convenient than that of BCC.cilium/ebpfAPI is also explicitly unstable. They state that programs will have to be updated for future versions of the library. Moreover, we do not have a Prometheus metrics export mechanism for Go services so that work will have to be duplicated from Python. In short, we did not pickcilium/ebpfbecause BCC is easier to work with, more mature, and more popular (hence more support available), and also allows us to use existing metrics support in Python. -
iovisor/gobpf: These are Go bindings for BCC.gobpfwill allow us to reuse the BPF code we write for the Python bindings for BCC. It also contains tools for compiling that program and loading into the kernel from a Go binary which would contain the front-end program. The reason we are not pickinggobpfis because our metrics pipeline has a transformation step from Prometheus metrics to gRPC structures for consumption bymagmad. We already implement this transformation in Python and C++, but not in Go. In the future, we may implement this transformation in Go to move gateway services from Python/C++ to Go. If we do so, we should consider usinggobpfforkernsnoopd. -
cloudflare/ebpf_exporter: This usesgobpfbehind the scenes. It handles compiling and loading the provided eBPF C program just like Python tools for BCC do. It allows the frontend program to be generated from a YAML specification.ebpf_exportermay have been a good choice if we were using standard Prometheus metrics collection and export methods, but we do not. Hence, we prefer an explicit Python frontend program.
While the eBPF-based alternatives present above can be used to implement a wide variety of observability tasks from inside the kernel, the non-eBPF ones are not extendable.
Cross-cutting concerns
There are several concerns that this proposal attempts to address:
Performance
Performance is a major concern for this proposal as we are putting code into the
kernel's network path on the access gateway. We benchmarked the eBPF code above
using the Spirent lab setup. Four tests were run in total, each with 600 user
devices, 5 MB download rate per device, and an attach rate of 10. The tests ran
for 30 minutes each. The tcp_sendmsg instrumentation was enabled for two tests
and disabled for the other two. No distinguishable downgrade in throughput was
observed when tcp_sendmsg instrumentation was enabled. The mean download
throughput for each of the four cases hovered around 530 Mbps.
For deployment, it will be important to count bytes only on the relevant
interfaces and relevant ports on the loopback interface. We want to observe
traffic on loopback as we use control_proxy to funnel traffic from Magma
daemons, but we want to ignore traffic on loopback that isn't destined for
control_proxy such as redis traffic or communication between magmad and
other daemons.
One way to further reduce the performance penalty is to use the TCP tracepoint
sock:inet_sock_set_state instead of tcp_sendmsg. sock:inet_sock_set_state
is fired when the kernel changes the state of a socket [3]. We could use this
event to collect metrics before a socket closes. However, this means that there
might be precision issues for long-running TCP streams.
A minor performance concern relates to compiling the kernel instrumentation
code from C to BPF bytecode and loading it onto the kernel. We have benchmarked
the prototype program above on magma AGW VM and across 50 runs, it takes an
average of 1.75 sec for BCC to read the program from a separate source file,
compile it and load it into the kernel. Since this will only happen when the
kernsnoopd service starts, it is not cause for concern.
Deployment
This design will require BCC tools and Linux kernel headers to be installed on
the access gateway. Kernel headers are already installed. BCC is delivered
through apt packages bpfcc-tools, libbpfcc, and python3-bpfcc. Combined,
these packages have a download size of 15.5 MB and take up 63 MB of disk space
after installation (see Open Issues).
Compatibility
eBPF was originally introduced to the Linux kernel in 2014 with kernel version 3.15 [5]. It has been evolving since then, and the latest TCP tracepoints we talk about were introduced in kernel version 4.16 [3]. This is not a concern though as our access gateways are on Ubuntu Focal with kernel version 5.8+.
Observability and Debug
kernsnoopd will provide debug logs of collected counters for observability.
Appropriate nosetests will be included in the implementation to support
validation and debugging. Additionally, kernsnoopd will also provide the
GetMetrics gRPC methods to expose the Prometheus metrics.
From the GetMetrics method of kernsnoopd, metrics enter magmad and follow
the general metrics pipeline which is mature and
well-tested.
Security & privacy
The compiled instrumentation code from this proposal will be loaded into the kernel, but there should not be security concerns because eBPF statically verifies programs before loading and provides security guarantees. Unchecked memory access is not allowed, neither are unbounded loops [6]. The total number of instructions allowed is also limited [7].
The in-kernel program will be able to observe coarse network statistics for processes running on the access gateway. Individual packets will not be captured or inspected. Command line arguments of running processes will be read, but they will not be stored anywhere.
Open issues
-
Is 63 MB of additional disk space required to install
bpfcc-toolson the access gateway really not a problem? Discuss with DevOps. -
We do not want to instrument the data path. Should we observe all interfaces on the gateway? If not, what subset should we observe? This is crucial to reducing performance impact of the above design.
-
Is network utilization on our access gateway usually close to 100%? Are our gateways starving for CPU? We will design a lab experiment to quantify both the control path and data path impact of
kernsnoopd. This experiment will measure AGW capacity in terms of number of UEs, varying attach/detach rates, data path traffic. We will also aim to compensate statistically for the jitter in AGW capacity measurements.
Original design
We have arrived at the above design after a few rounds of discussion and feedback from the team. In the original design, we had planned to
-
Instrument the
net_dev_start_xmitevent, which is on the L2 network path. The authors ofnetqtop, a similar tool included in the BCC distribution, have benchmarked their tool and observe 1.17 usec increase in packet "pingpong" latency [2]. When they benchmark bandwidth on the loopback interface, they observe a drop of around 27% in packets per second (PPS). We also measured the performance impact and concluded that it was too high. To avoid this high penalty, we switched to attaching a kprobe to thetcp_sendmsgsyscall as an L2 hook would have higher performance impact. As a consequence, we lost the ability to observe L3 traffic such as that generated from the ping and traceroute probes that magmad sends periodically. But since those probes should not be consuming much bandwidth, we are willing to ignore them. -
Have packet counters in addition to byte counters. We dropped packet counters as it is not possible to get accurate packet counts even with
net_dev_start_xmitbecause of NIC offloading. -
Put destination IP address and port as labels on Prometheus counters. Each distinct value for a label results in a separate Prometheus time series, and since destination IP addresses and ports have very large domains, the overhead of having separate time-series would be too high. We instead decided to label Magma traffic by destination cloud service.
Performance impact of L2 instrumentation
We evaluated the performance impact of instrumenting the net_dev_start_xmit
kernel event using the Spirent lab setup as we did for tcp_sendmsg. Two
tests were run, one with net_dev_start_xmit instrumentation disabled, and one
with it enabled. Each test had 600 user devices, 5 MB download rate per device,
and an attach rate of 10. The tests ran for 30 minutes each.
When net_dev_start_xmit instrumentation was disabled, the mean download
throughput was roughly 540 Mbps. When it was enabled, the mean download
throughput reduced to 430 Mbps, a 20% reduction.
We also stress-tested the net_dev_start_xmit instrumentation. The most
expensive operation in the relevant callback is incrementing a value in the BPF
hash map. We put the increment operation in a loop and iterated it n times.
When n = 100, the mean download throughput reduction was modest: from 430 Mbps
to 420 Mbps. For n = 150 and n = 175, no noticeable reduction was observed
compared to n = 100. However, at n = 200, download throughput collapsed
completely and produced a mean of around 5.5 Mbps with the peak hitting 75 Mbps.
This sudden drop in throughput may have to do with excessive packet loss because
of the slow callback function.
References
[1]: Jay Schulist, Daniel Borkmann, Alexei Starovoitov. 2018. Linux Socket Filtering aka Berkeley Packet Filter (BPF). https://www.kernel.org/doc/Documentation/networking/filter.txt
[2]: yonghong-song. 2020. Netqtop 3037. https://github.com/iovisor/bcc/pull/3048
[3]: Brendan Gregg. 2018. TCP Tracepoints. https://www.brendangregg.com/blog/2018-03-22/tcp-tracepoints.html
[4]: pflua-bench. 2016. https://github.com/Igalia/pflua-bench
[5]: Alexei Starovoitov. 2014. net: filter: rework/optimize internal BPF interpreter's instruction set. https://www.kernel.org/doc/Documentation/networking/filter.txt
[6]: Alexei Starovoitov. 2019. bpf: introduce bounded loops. https://git.kernel.org/pub/scm/linux/kernel/git/netdev/net-next.git/commit/?id=2589726d12a1b12eaaa93c7f1ea64287e383c7a5
[7]: Quentin Monnet. 2021. eBPF Updates #4: In-Memory Loads Detection, Debugging QUIC, Local CI Runs, MTU Checks, but No Pancakes. https://ebpf.io/blog/ebpf-updates-2021-02
[8]: Ivan Babrou. 2018. eBPF overhead benchmark. https://github.com/cloudflare/ebpf_exporter/tree/master/benchmark