Custom Grafana Dashboards
Grafana is now replacing the metrics dashboards in the NMS. Grafana provides a much more powerful, configurable, and user-friendly dashboarding solution. Any users within an organization can create and edit custom timeseries dashboards that will be visible to all other users in their organization.
An important detail is that Grafana access is limited only to users in an organization with the "Super-User" title (you will select this when provisioning users in an organization). This is a technical workaround to ensure that users with additional network visibility restrictions within an organization can't see information from networks that they are restricted from as Grafana will allow all users to query across any network that the organization owns.
Enabling Access
The feature flag is enabled by default for all new organizations created in the
NMS. If you want to turn this feature off or on, you can do so from the
master organization.
Login to the master organization, navigate to the feature flag page using
the left sidebar, then edit the feature flag named
"Include tab for Grafana in the Metrics page". Support can be turned on and off
for individual organizations.
What’s New?
In the metrics page of the nms, there is now a tab called ‘Grafana’. When you click on this link we have to do some book-keeping on the backend, so the initial load may take a few seconds.
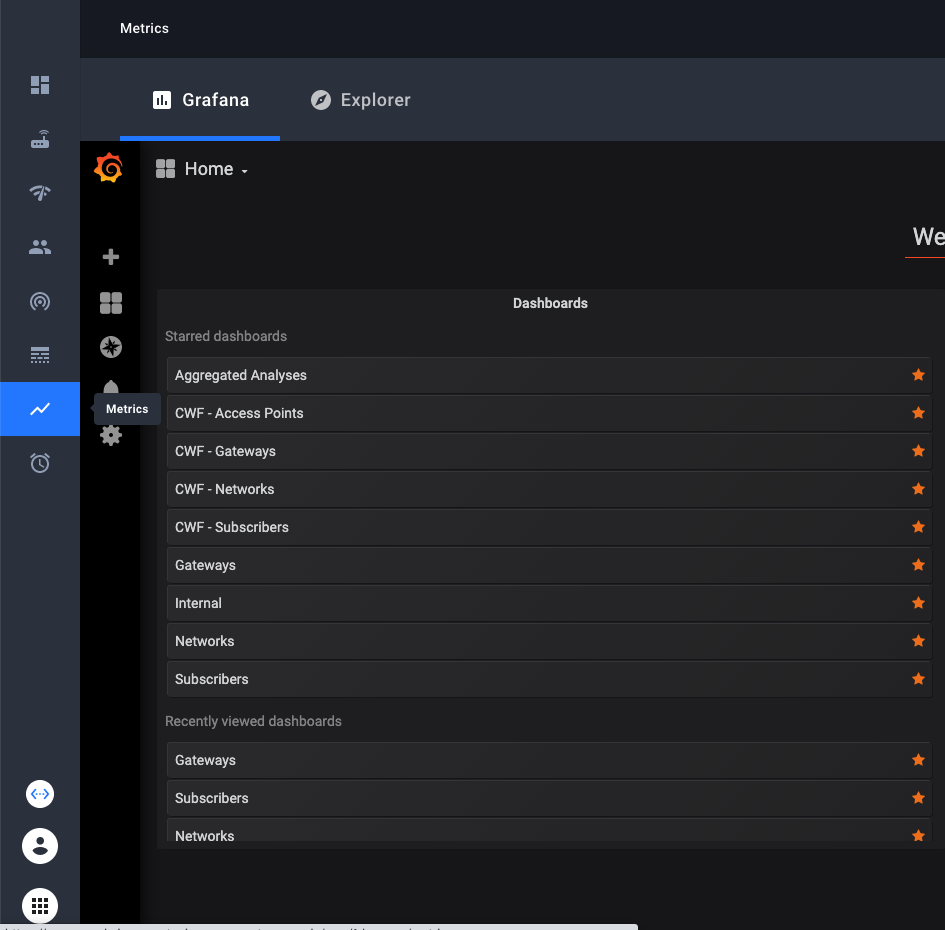
You’ll see three dashboards available to you from the start. These replicate the three dashboards in the NMS that are built-in. Go to one of the dashboards and you’ll now see a Grafana version of the NMS dashboard.
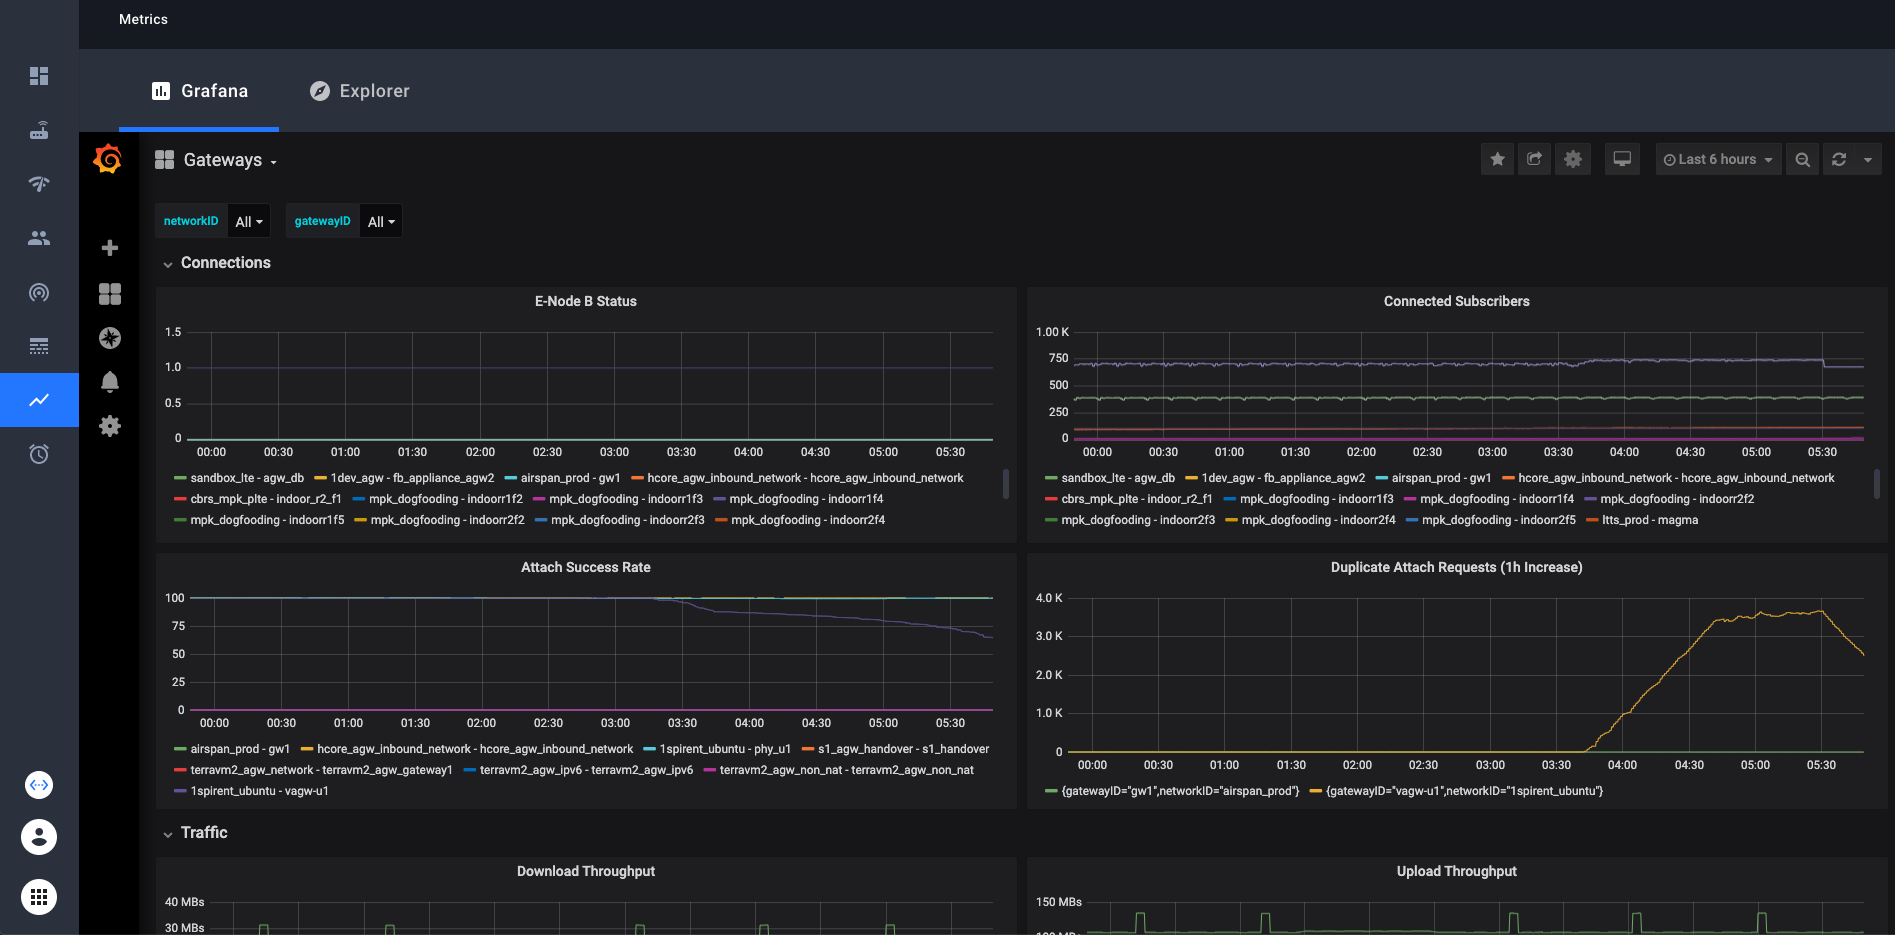
These dashboards contain dropdown selectors to choose which network(s) and gateway(s) you want to look at. In the NMS dashboard you were only able to look at one network at a time but in Grafana you can look at any collection of networks or gateways your organization has access to at once. Simply select or deselect the networks/gateways that you want to see and the graphs will be updated. In the top right corner, there is an option to choose the time range that the graphs display. The default is 6 hours.
Custom Dashboards
With Grafana, you can create your own custom dashboards and populate them with any graphs and queries you want. These custom dashboards will be visible to all other users in the organization that you belong to in the NMS.
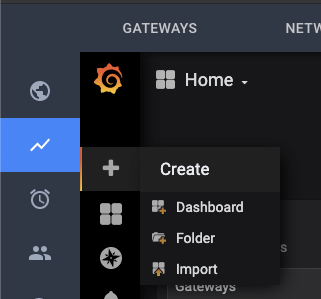
The simple way is to just click on the “+” icon on the left sidebar, then create a new dashboard. There is ample documentation about grafana dashboards online if you need help creating your dashboard.
-
Grafana documentation on creating dashboards: Grafana Dashboards
-
Prometheus documentation on writing queries: Prometheus Querying
If you want to replicate the networkID or gatewayID variables that you find in the preconfigured dashboards, we provide a “template” dashboard to make that easy. Simply open the Template dashboard, and click on the gear icon near the top right. From there, click “Save As” and enter the name you want. Your new dashboard will now have the gatewayID and networkID variables.
An example of how to use these variables in your queries:
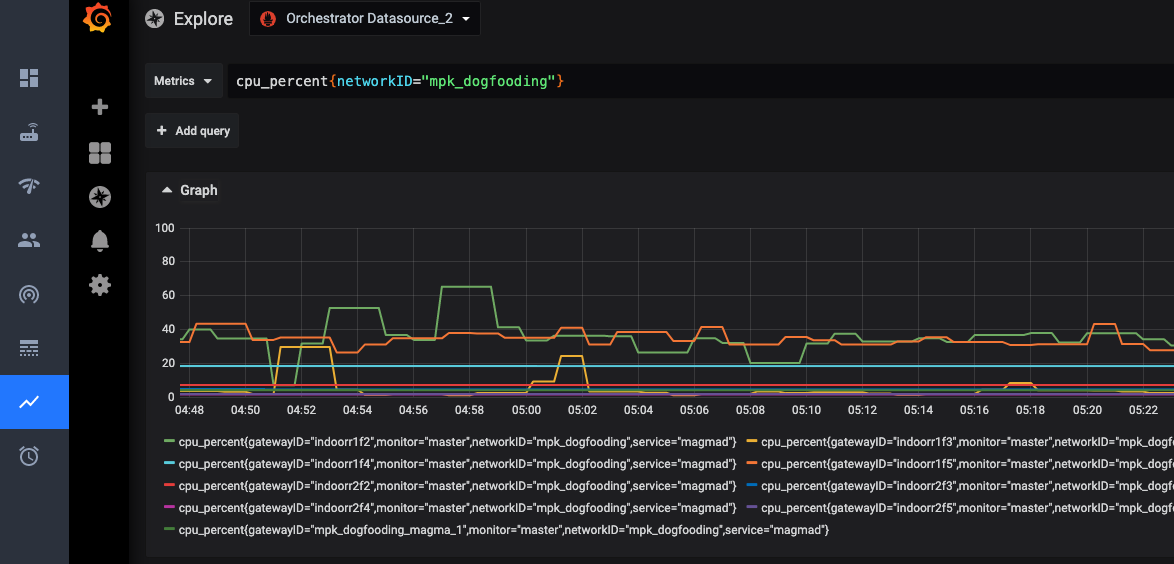
Some technical details: You need to use =~ when matching label names with
these variables in order to see more than one network or gateway at a time.
This is because the =~ operator tells Prometheus to match the value as a
regex.