Top Level Dashboard
Network
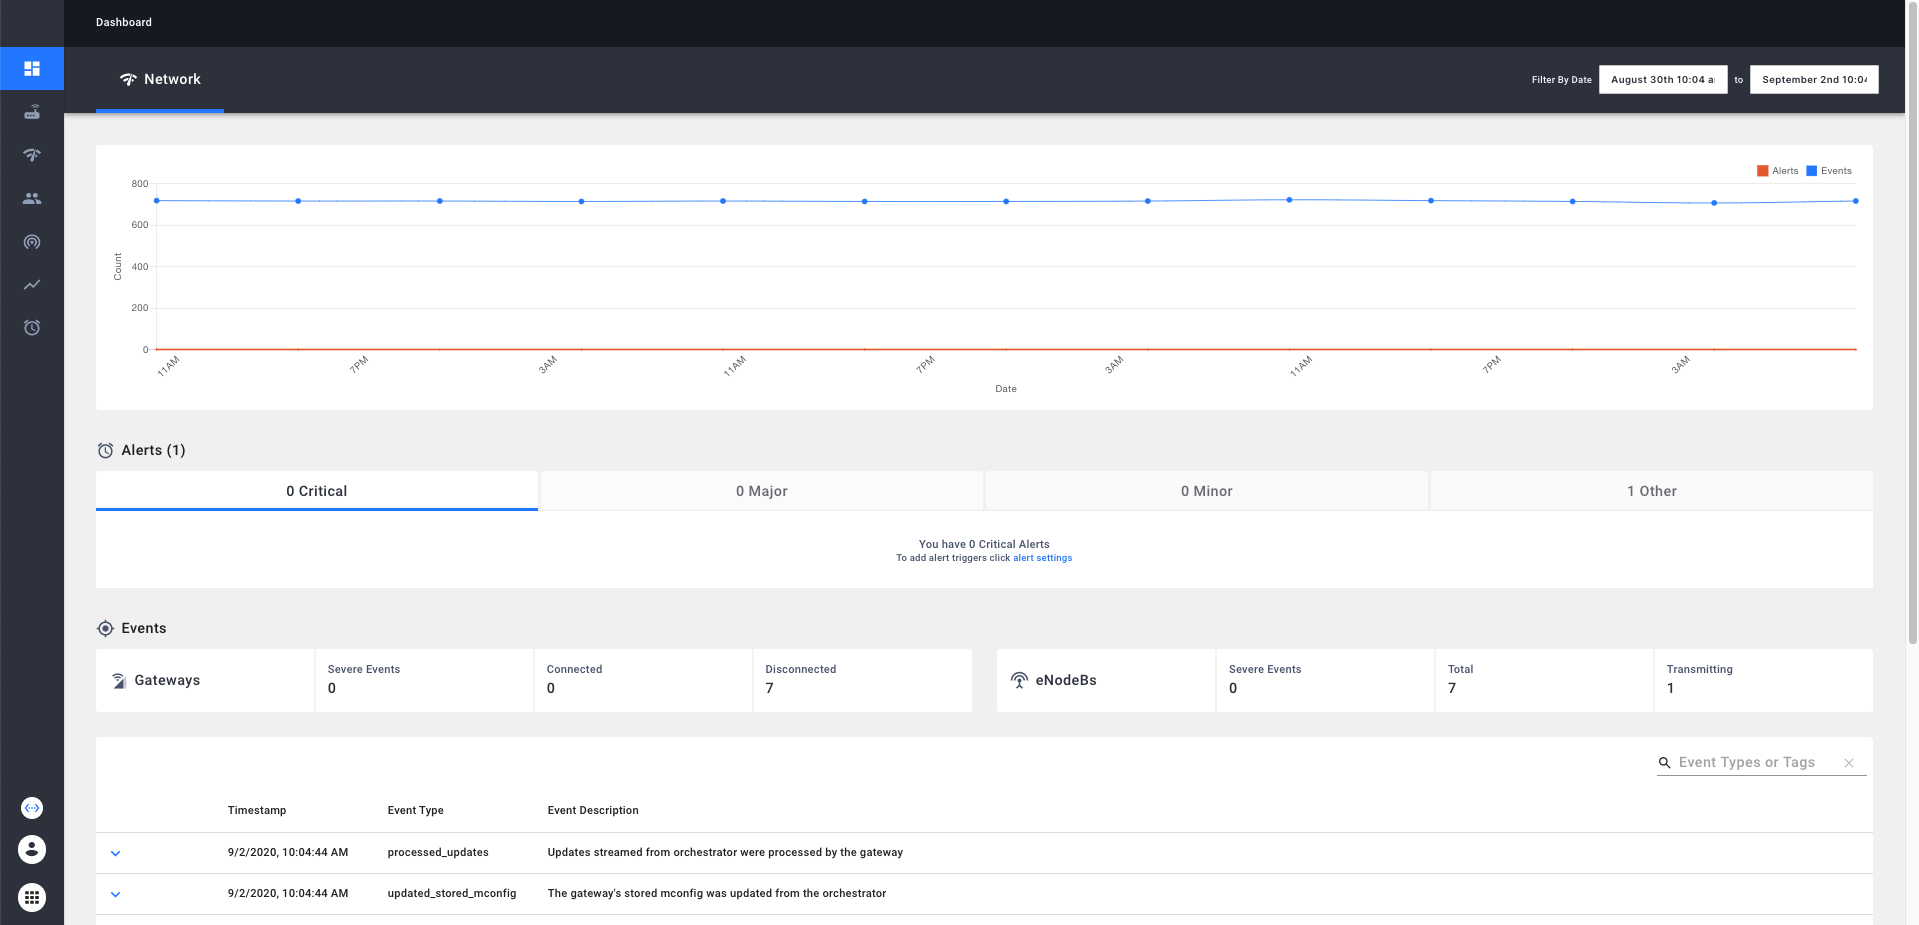
The network tab contains the following components:
- Chart displaying frequency of alerts and events over time. The chart and event table data is selected over a default time period of the last 3 days. This time period can be modified through the datetime selector on the top right hand corner of the dashboard.
- Alert table displaying 'Critical', 'Major', 'Minor' and 'Misc' alerts.
- KPI metrics across all gateways
- Severe events that have occurred in the gateway(TBD)
- Total number of healthy gateways (number of gateways which have checked in within the last 5 minutes)
- Total number of unhealthy gateways
- KPI metrics across all eNodeBs
- Severe events that have occurred in the eNodeB(TBD)
- Total number of eNodeBs
- Total number of eNodeBs currently transmitting
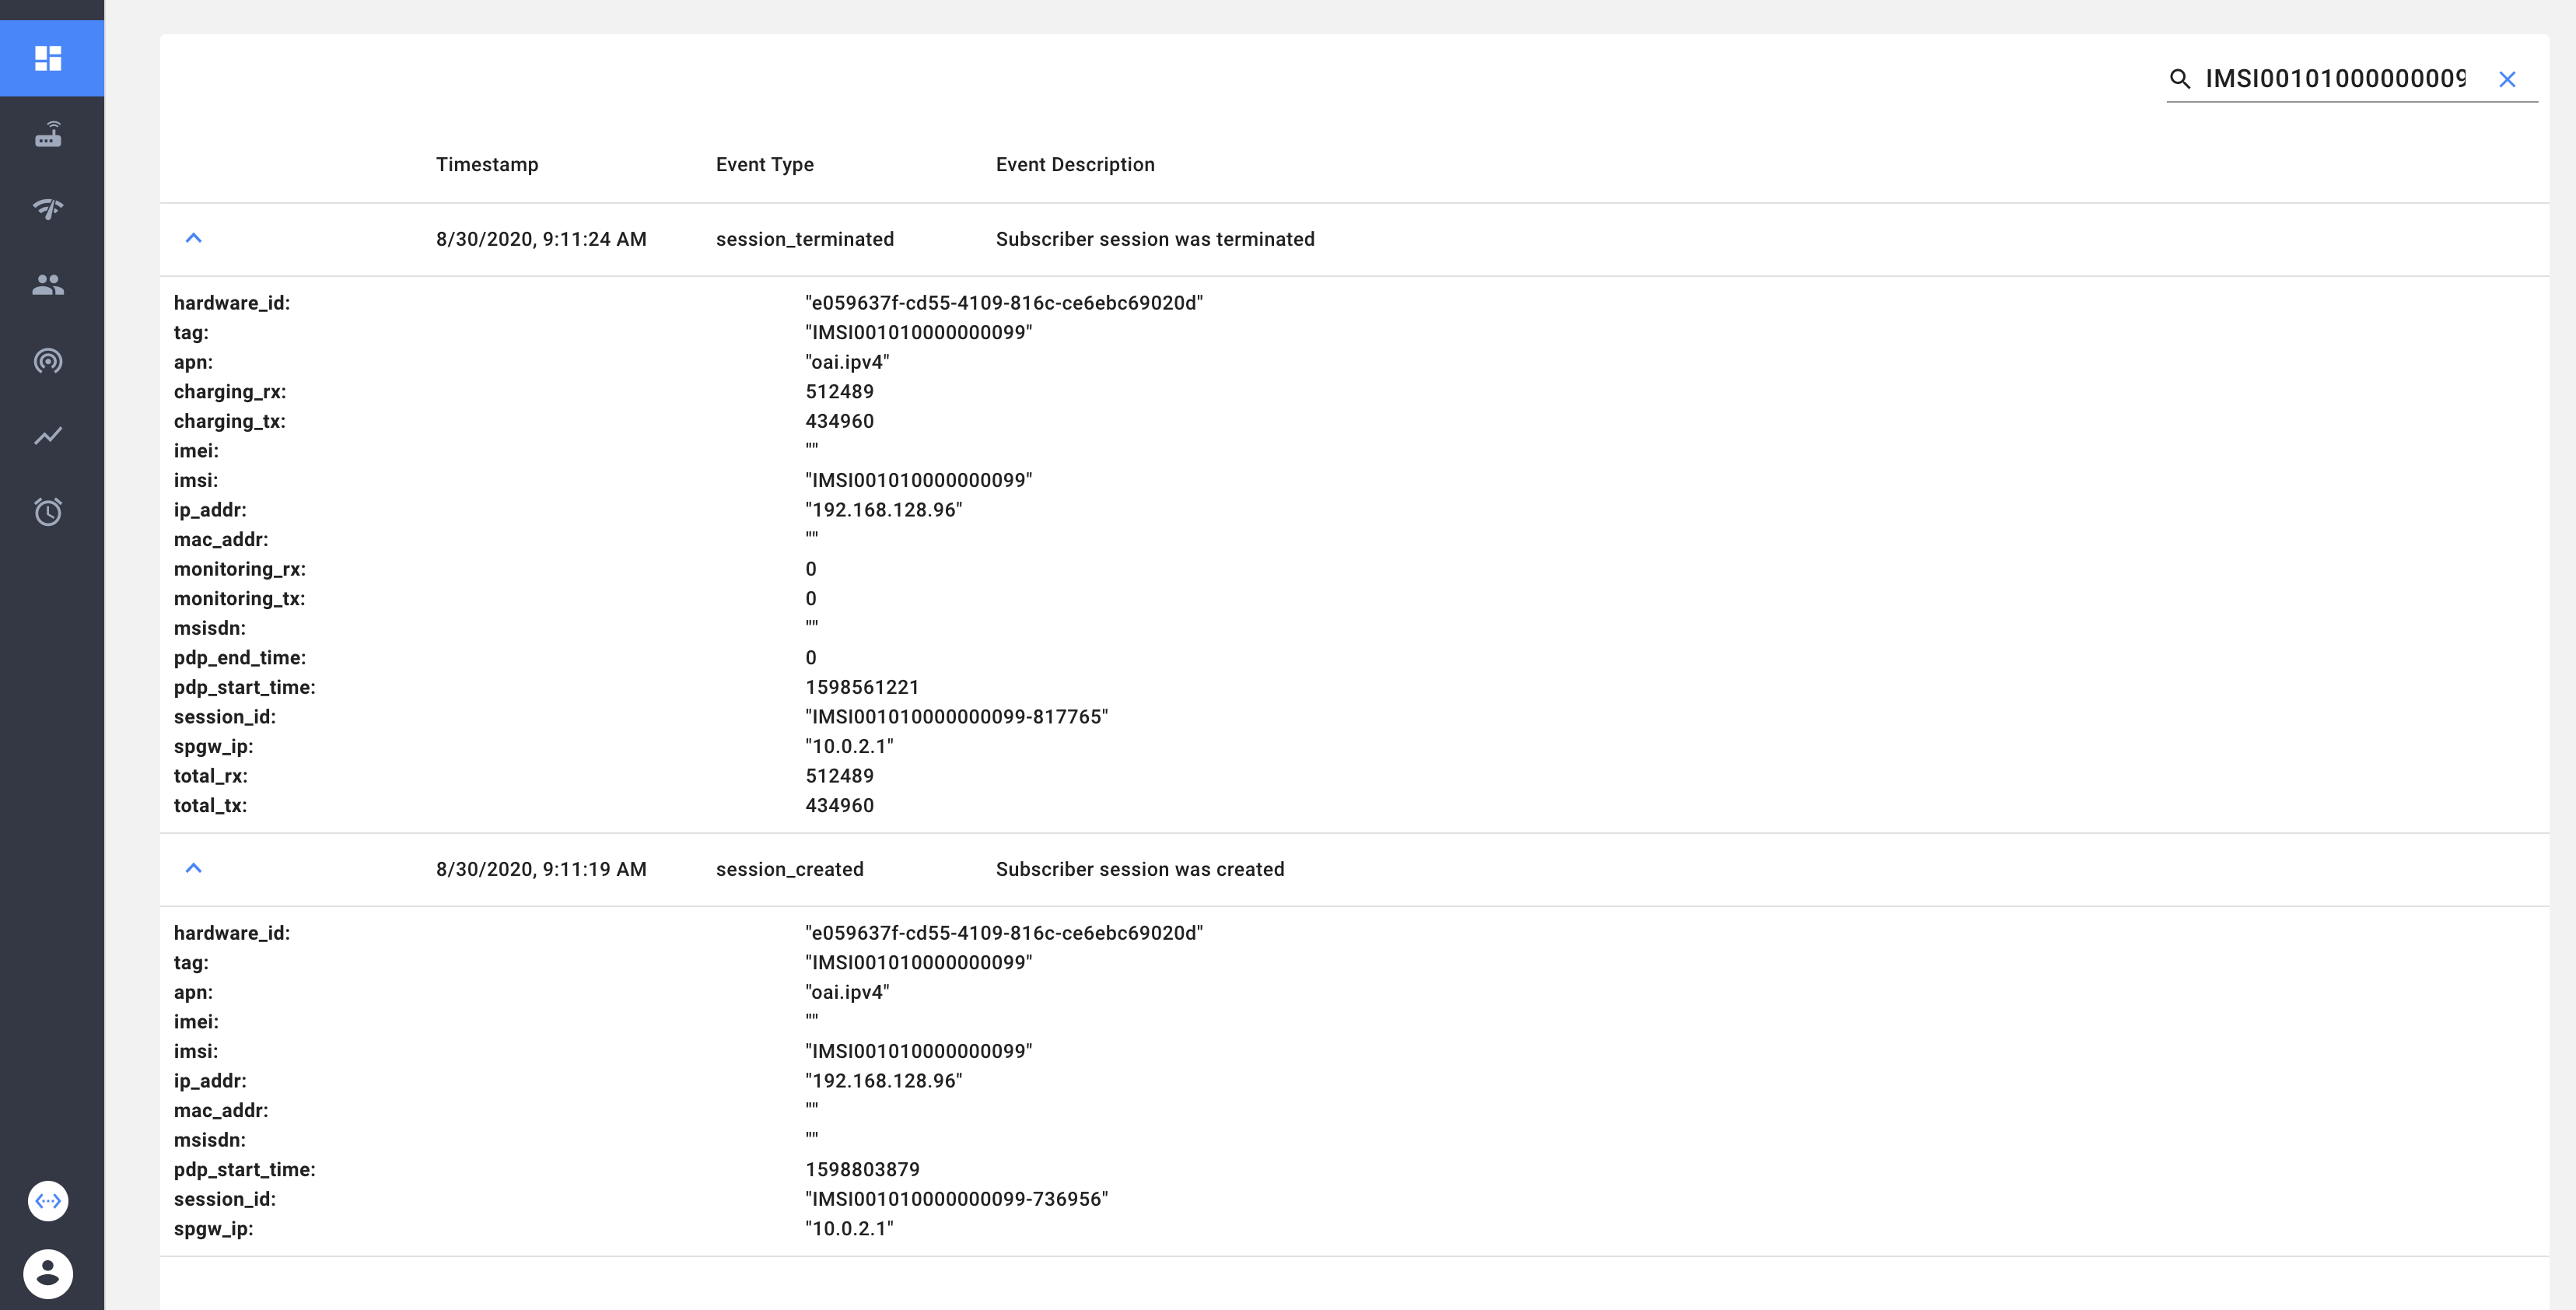
- Network wide event table
- This table mainly displays session and gateway specific events across the network.
- We can filter specific events by searching for either event types or event tags. Examples of event tags include hardware_id of a gateway or imsi of a subscriber.