Metrics
Overview
Magma gateways and orc8r generate a lot of metrics which provides a great deal of visibility into gateways, base stations, subscribers, reliability, throughput etc. These metrics are regularly pushed into prometheus, which along with grafana enables us to store and query for these metrics. All the metrics are stored in prometheus for a default of 30 days. For unlimited retention and a more scaled metrics pipeline, we also support deploying magma with Thanos.
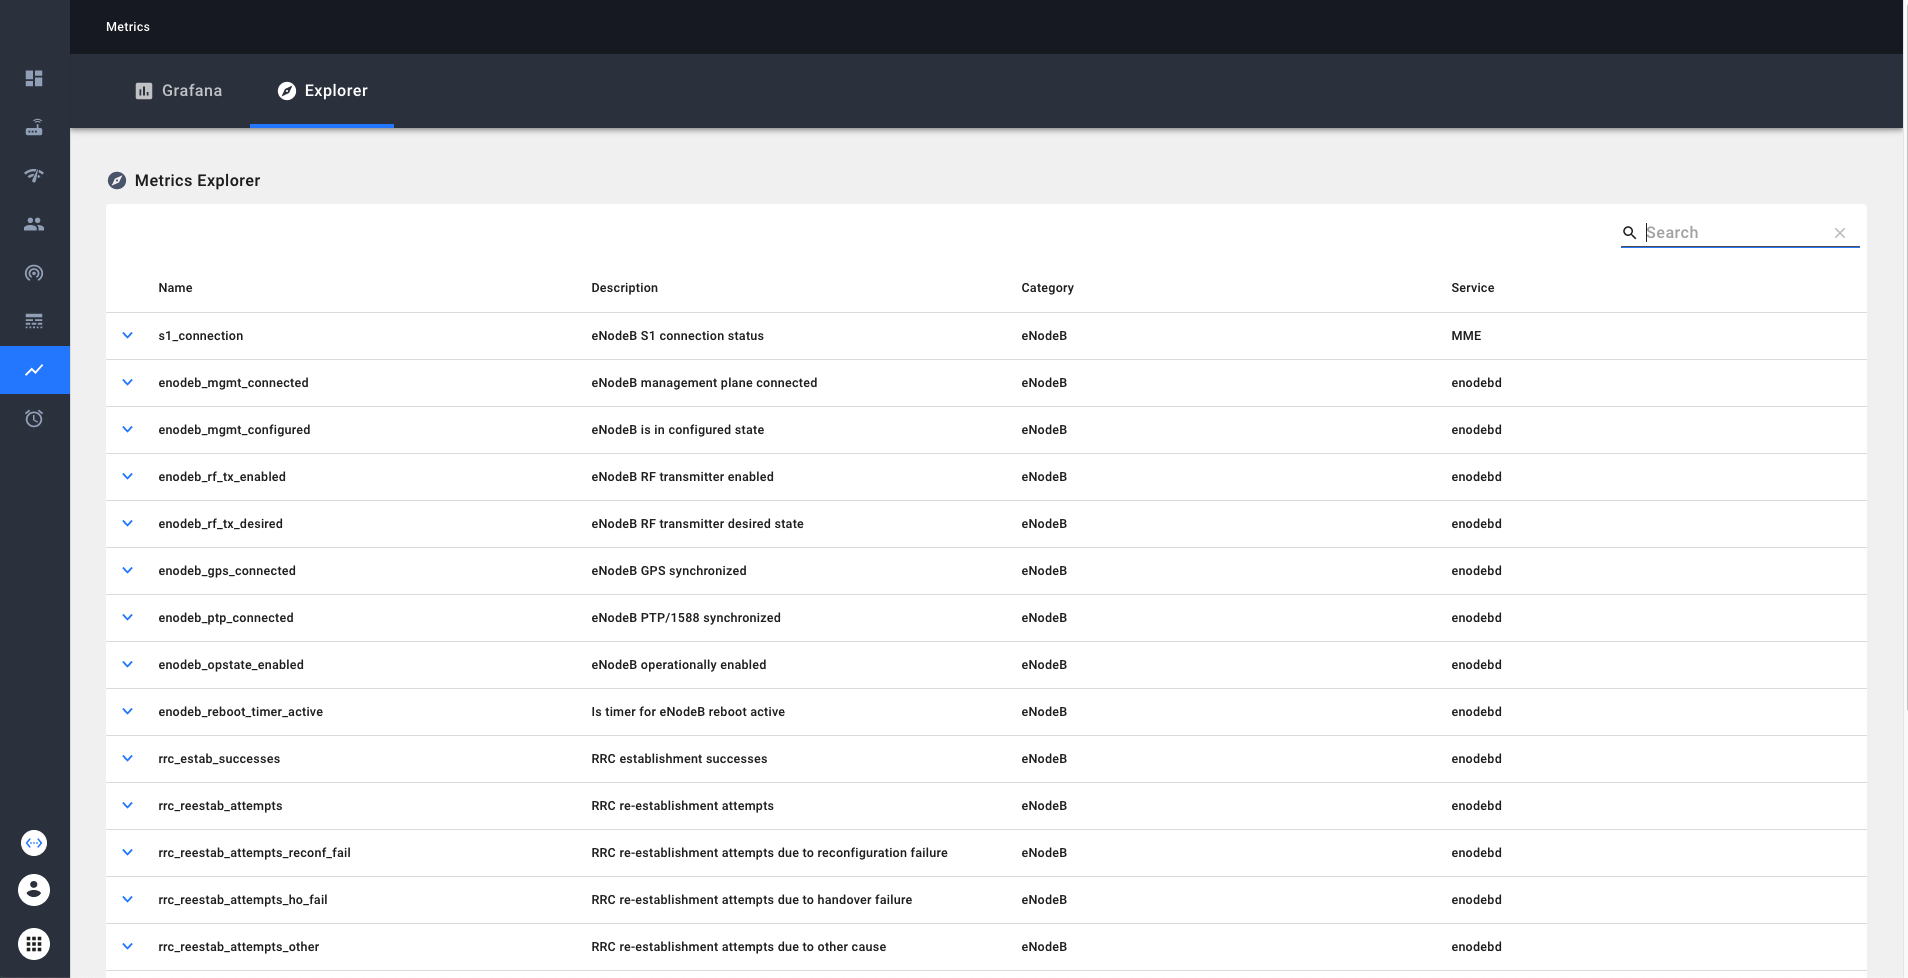
Metrics Explorer
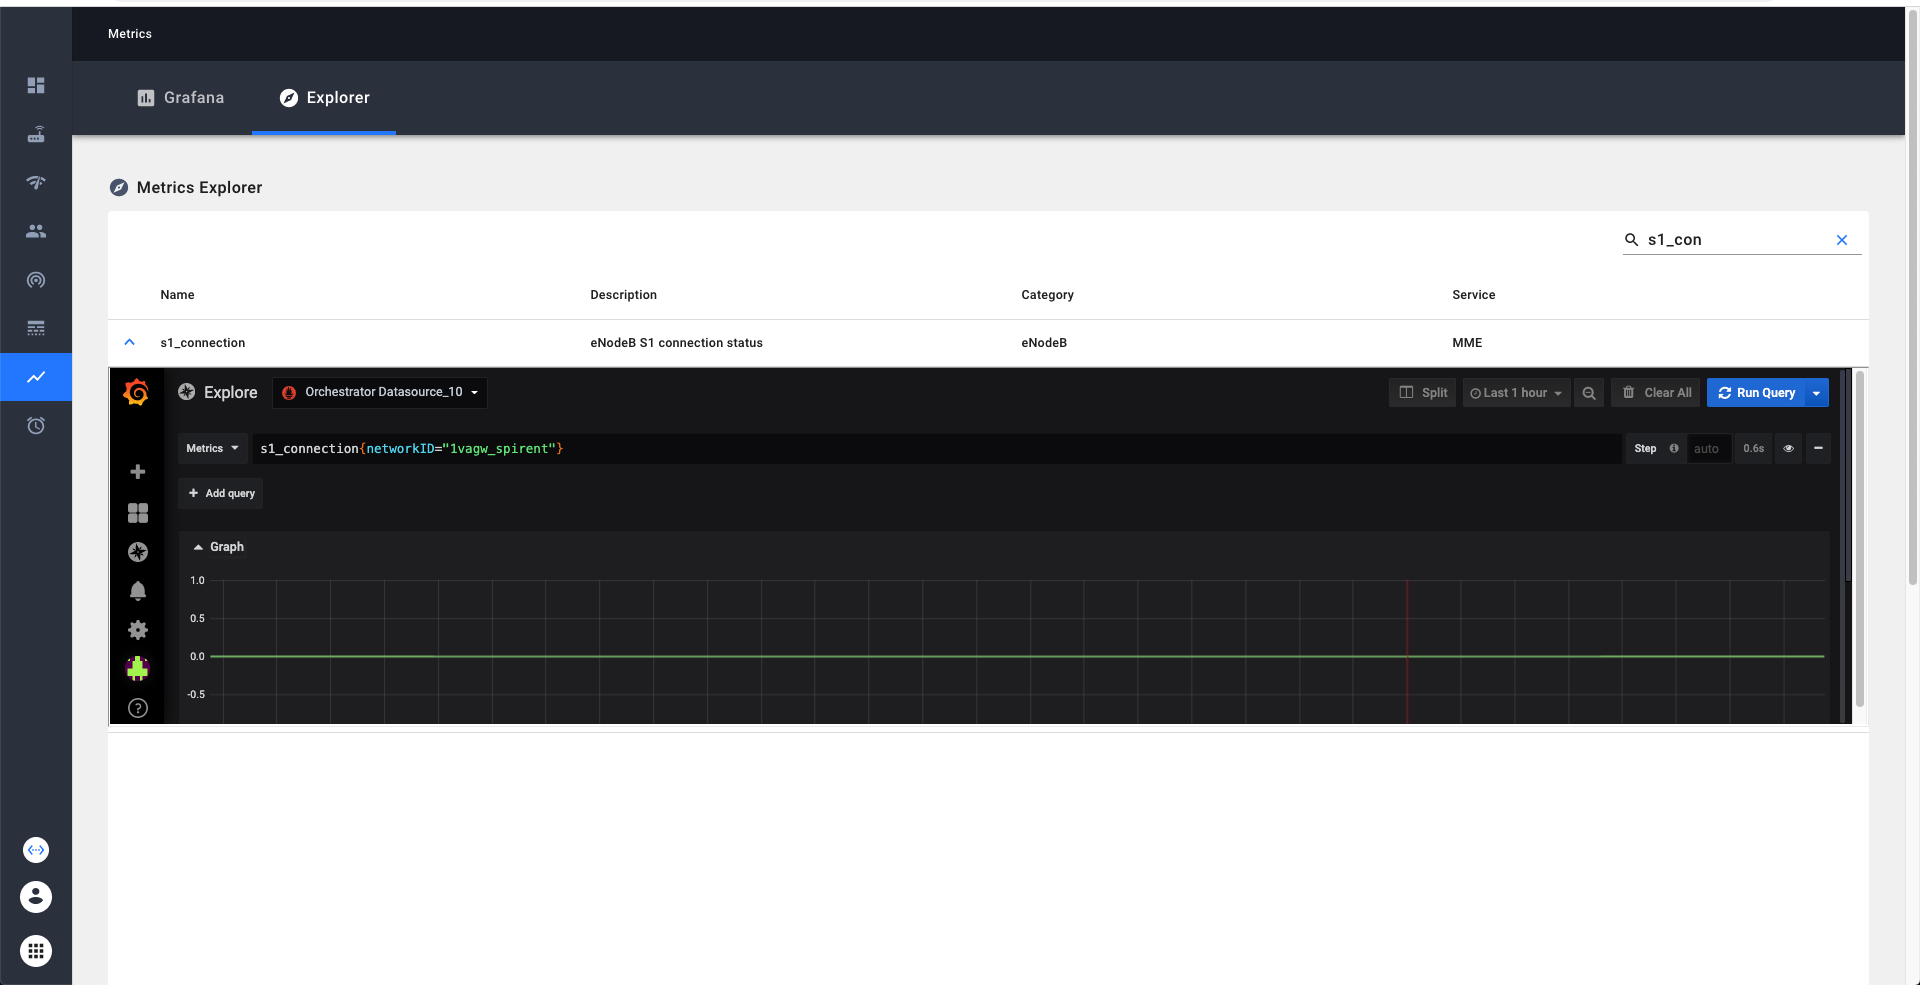
Metrics explorer provides an easy way to learn and explore the metrics available in our system. Metrics explorer can be viewed through NMS. We can search and filter the metrics by the name or description. Additionally if we click on the detailed view on the metric, we enable exploring the current trends on the metric via grafana explorer.
Grafana
Grafana provides a powerful, configurable, and user-friendly dashboarding solution. Any users within an organization can create and edit custom timeseries dashboards that will be visible to all other users in their organization. An important detail is that Grafana access is limited only to users in an organization with the "Super-User" title (you will select this when provisioning users in an organization). This is a technical workaround to ensure that users with additional network visibility restrictions within an organization can't see information from networks that they are restricted from as Grafana will allow all users to query across any network that the organization owns.
When you click on this link we have to do some book-keeping on the backend, so the initial load may take a few seconds.
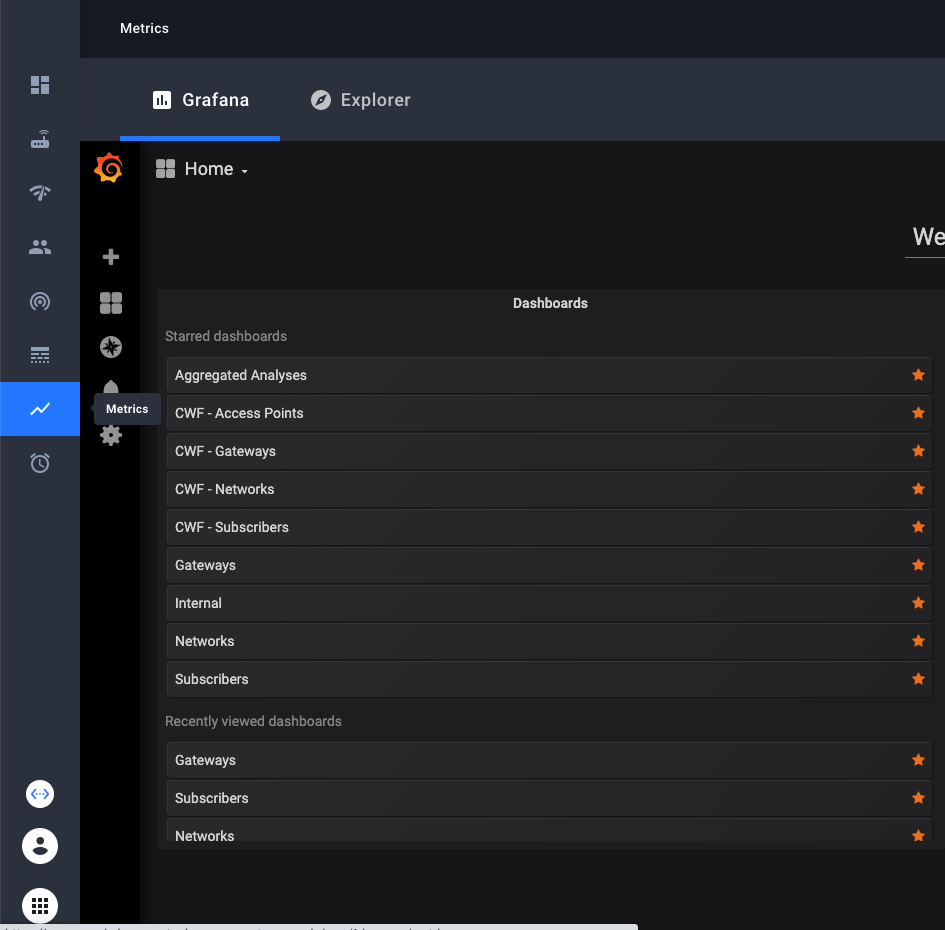 You’ll see built in dashboards available to you.
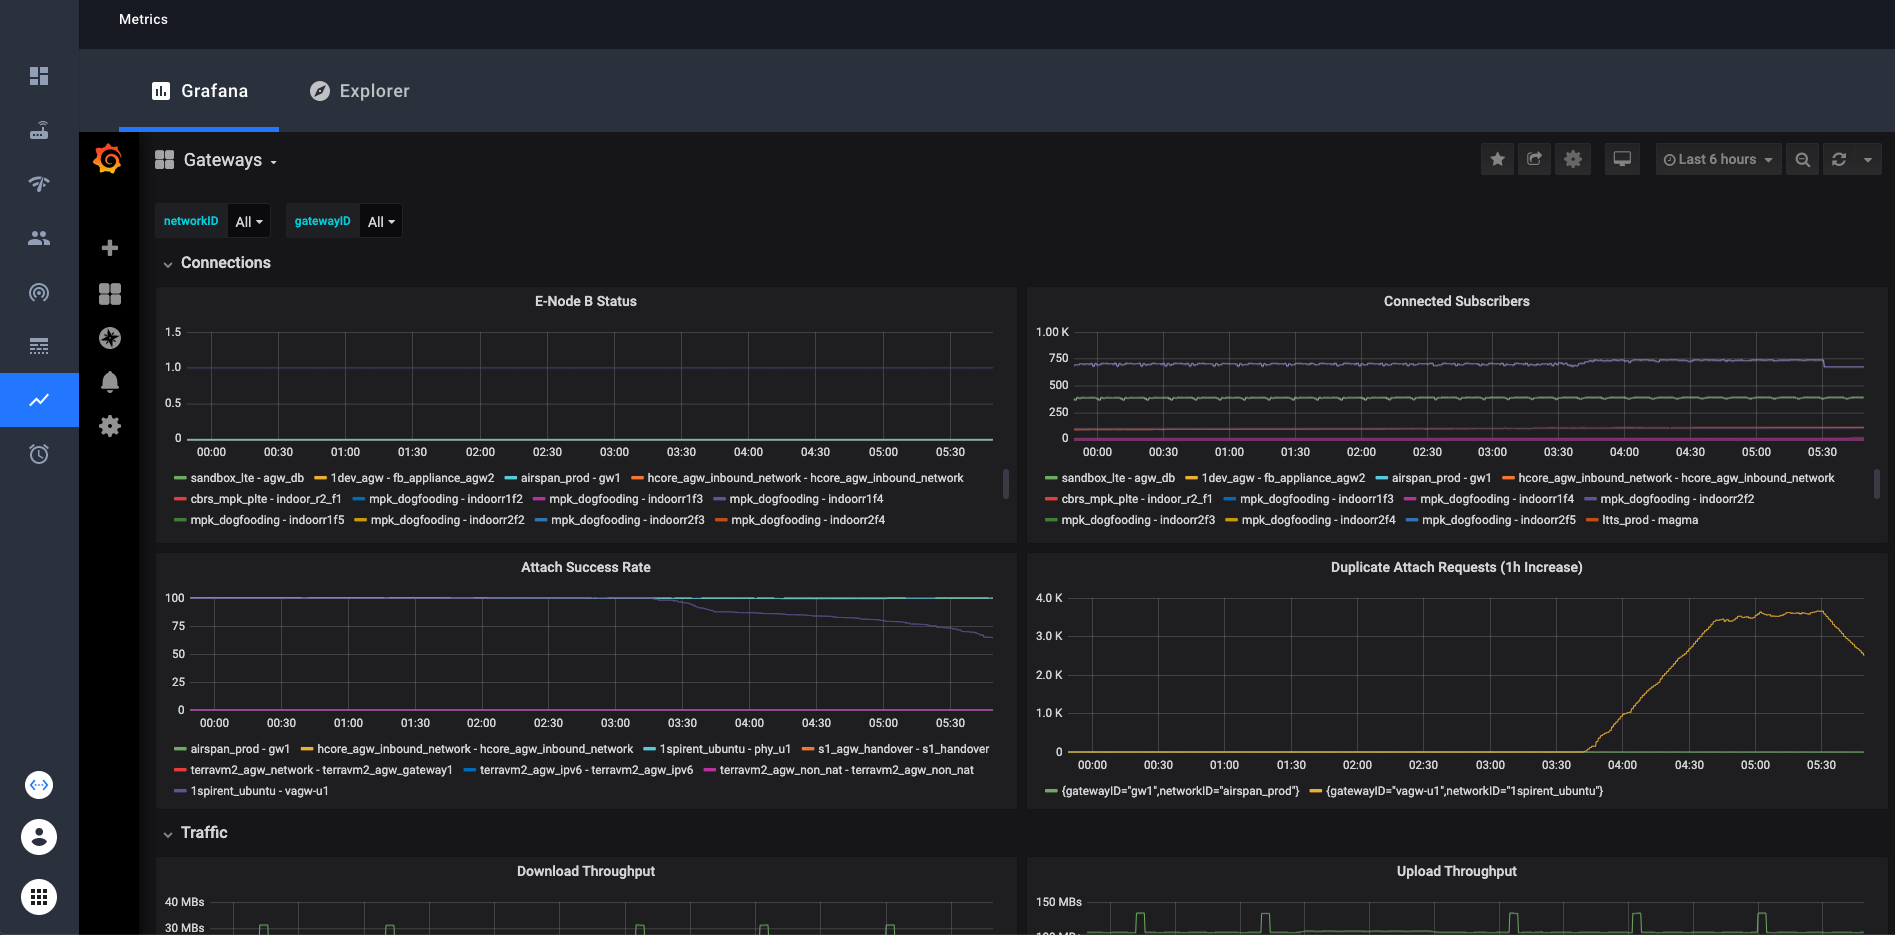 These dashboards contain dropdown selectors to choose which network(s) and gateway(s) you want to look at.
In Grafana you can look at any collection of networks or gateways your organization has access to at once. Simply select or
deselect the networks/gateways that you want to see and the graphs will be updated. In the top right corner, there is an option to choose the time range that the graphs display. The default is 6 hours.
These dashboards contain dropdown selectors to choose which network(s) and gateway(s) you want to look at.
In Grafana you can look at any collection of networks or gateways your organization has access to at once. Simply select or
deselect the networks/gateways that you want to see and the graphs will be updated. In the top right corner, there is an option to choose the time range that the graphs display. The default is 6 hours.
Custom Dashboards
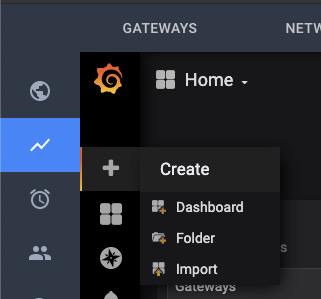
With Grafana, you can create your own custom dashboards and populate them with any graphs and queries you want. These custom dashboards will be visible to all other users in the organization that you belong to in the NMS. The simple way is to just click on the “+” icon on the left sidebar, then create a new dashboard. There is ample documentation about grafana dashboards online if you need help creating your dashboard.
- Grafana documentation on creating dashboards: Grafana Dashboards
- Prometheus documentation on writing queries: Prometheus Querying
If you want to replicate the networkID or gatewayID variables that you find in the preconfigured dashboards, we provide a “template” dashboard to make that easy. Simply open the Template dashboard, and click on the gear icon near the
top right. From there, click “Save As” and enter the name you want. Your new dashboard will now have the gatewayID and networkID variables. An example of how to use these variables in your queries:
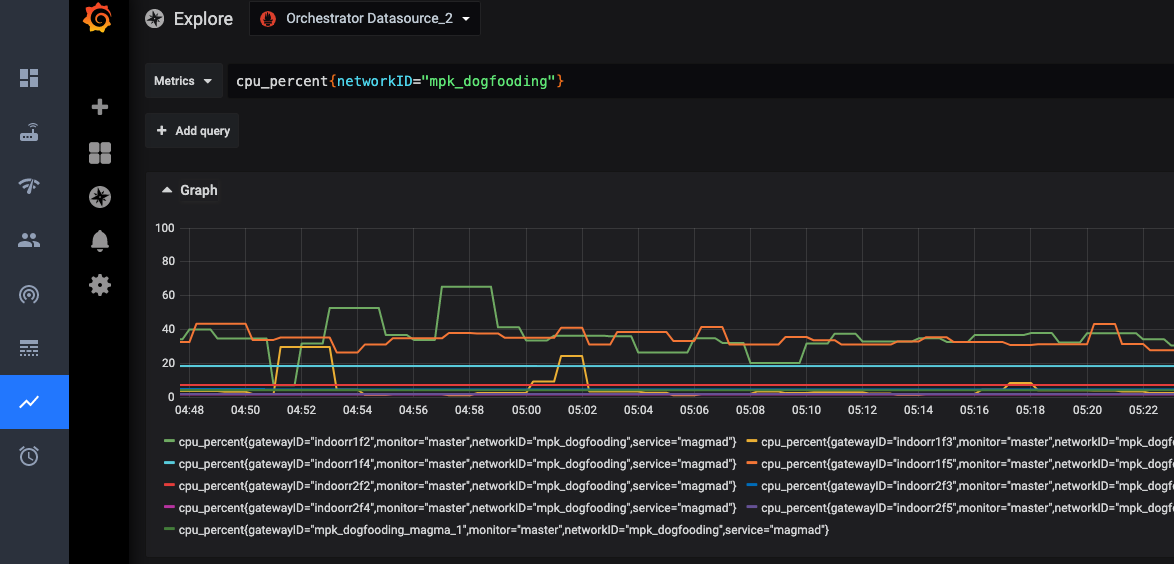 Some technical details: You need to use
 =~ when matching label names with these variables in order to see more than one network or gateway at a time. This is because the =~ operator tells Prometheus to match the value as a regex.
Enabling Access
The feature flag is enabled by default for all new organizations created in the NMS. If you want to turn this feature off or on, you can do so from the host organization. Log in to the host organization, navigate to the feature flag page using
the left sidebar, then edit the feature flag named "Include tab for Grafana in the Metrics page". Support can be turned on and off for individual organizations.
List of metrics which are currently available
Up-to-date view would be available through metrics explorer
| Metric Identifier | Description | Category | Service |
|---|---|---|---|
| s1_connection | eNodeB S1 connection status | eNodeB | MME |
| user_plane_bytes_ul | User plane uplink bytes | eNodeB | |
| user_plane_bytes_dl | User plane downlink bytes | eNodeB | |
| enodeb_mgmt_connected | eNodeB management plane connected | eNodeB | enodebd |
| enodeb_mgmt_configured | eNodeB is in configured state | eNodeB | enodebd |
| enodeb_rf_tx_enabled | eNodeB RF transmitter enabled | eNodeB | enodebd |
| enodeb_rf_tx_desired | eNodeB RF transmitter desired state | eNodeB | enodebd |
| enodeb_gps_connected | eNodeB GPS synchronized | eNodeB | enodebd |
| enodeb_ptp_connected | eNodeB PTP/1588 synchronized | eNodeB | enodebd |
| enodeb_opstate_enabled | eNodeB operationally enabled | eNodeB | enodebd |
| enodeb_reboot_timer_active | Is timer for eNodeB reboot active | eNodeB | enodebd |
| enodeb_reboots | eNodeb reboots counter | eNodeB | enodebd |
| rcc_estab_attempts | RRC establishment attempts | eNodeB | enodebd |
| rrc_estab_successes | RRC establishment successes | eNodeB | enodebd |
| rrc_reestab_attempts | RRC re-establishment attempts | eNodeB | enodebd |
| rrc_reestab_attempts_reconf_fail | RRC re-establishment attempts due to reconfiguration failure | eNodeB | enodebd |
| rrc_reestab_attempts_ho_fail | RRC re-establishment attempts due to handover failure | eNodeB | enodebd |
| rrc_reestab_attempts_other | RRC re-establishment attempts due to other cause | eNodeB | enodebd |
| rrc_reestab_successes | RRC re-establishment successes | eNodeB | enodebd |
| erab_estab_attempts | ERAB establishment attempts | eNodeB | enodebd |
| erab_estab_failures | ERAB establishment failures | eNodeB | enodebd |
| erab_estab_successes | ERAB establishment successes | eNodeB | enodebd |
| erab_release_requests | ERAB release requests | eNodeB | enodebd |
| erab_release_requests_user_inactivity | ERAB release requests due to user inactivity | eNodeB | enodebd |
| erab_release_requests_normal | ERAB release requests due to normal cause | eNodeB | enodebd |
| erab_release_requests_radio_resources_not_available | ERAB release requests due to radio resources not available | eNodeB | enodebd |
| erab_release_requests_reduce_load | ERAB release requests due to reducing load in serving cell | eNodeB | enodebd |
| erab_release_requests_fail_in_radio_proc | ERAB release requests due to failure in the radio interface procedure | eNodeB | enodebd |
| erab_release_requests_eutran_reas | ERAB release requests due to EUTRAN generated reasons | eNodeB | enodebd |
| erab_release_requests_radio_conn_lost | ERAB release requests due to radio connection with UE lost | eNodeB | enodebd |
| erab_release_requests_oam_intervention | ERAB release requests due to OAM intervetion | eNodeB | enodebd |
| pdcp_user_plane_bytes_ul | User plane uplink bytes at PDCP | eNodeB | enodebd |
| pdcp_user_plane_bytes_dl | User plane downlink bytes at PDCP | eNodeB | enodebd |
| ip_address_allocated | Total IP addresses allocated | AGW | mobilityd |
| ip_address_released | Total IP addresses released | AGW | mobilityd |
| s6a_auth_success | Total successful S6a auth requests | AGW | subscriberdb |
| s6a_auth_failure | Total failed S6a auth requests | AGW | subscriberdb |
| s6a_location_update | Total S6a lcoation update requests | AGW | subscriberdb |
| diameter_capabilities_exchange | Total Diameter capabilities exchange requests | AGW | subscriberdb |
| diameter_watchdog | Total Diameter watchdog requests | AGW | subscriberdb |
| diameter_disconnect | Total Diameter disconnect requests | AGW | subscriberdb |
| dp_send_msg_error | Total datapath message send errors | AGW | pipelined |
| arp_default_gw_mac_error | Total errors with default gateway MAC resolution | AGW | pipelined |
| openflow_error_msg | Total openflow error messages received by code and type | AGW | pipelined |
| unknown_pkt_direction | Counts number of times a packet is missing its flow direction | AGW | pipelined |
| enforcement_rule_install_fail | Counts number of times rule install failed in enforcement app | AGW | pipelined |
| enforcement_stats_rule_install_fail | Counts number of times rule install failed in enforcement stats app | AGW | pipelined |
| network_iface_status | Status of a network interface required for data pipeline | AGW | pipelined |
| subscriber_icmp_latency_ms | Reported latency for subscriber in milliseconds | AGW | monitord |
| magmad_ping_rtt_ms | Gateway ping metrics in milliseconds | AGW | magmad |
| cpu_percent | System-wide CPU utilization as percentage over 1 second | AGW | magmad |
| swap_memory_percent | Percent of memory that can be assigned to processes | AGW | magmad |
| virtual_memory_percent | Percent of memory that can be assigned to processes without the system going to swap | AGW | magmad |
| mem_total | Total memory | AGW | magmad |
| mem_available | Available memory | AGW | magmad |
| mem_used | Used memory | AGW | magmad |
| mem_free | Free memory | AGW | magmad |
| disk_percent | Percent of disk space used for the volume mounted at root | AGW | magmad |
| bytes_sent | System-wide network I/O bytes sent | AGW | magmad |
| bytes_received | System-wide network I/O bytes received | AGW | magmad |
| temperature | Temperature readings from system sensors | AGW | magmad |
| checkin_status | 1 for checkin success, and 0 for failure | AGW | magmad |
| bootstrap_exception | Count for exceptions raised by bootstrapper | AGW | magmad |
| unexpected_service_restarts | Count of unexpected service restarts | AGW | magmad |
| unattended_upgrade_status | Unattended Upgrade status | AGW | magmad |
| service_restart_status | Count of service restarts | AGW | magmad |
| enb_connected | Number of eNodeb connected to MME | AGW | MME |
| ue_registered | Number of UE registered successfully | AGW | MME |
| ue_connected | Number of UE connected | AGW | MME |
| ue_attach | Number of UE attach success | AGW | MME |
| ue_detach | Number of UE detach | AGW | MME |
| s1_setup | Counter for S1 setup success | AGW | MME |
| mme_sgs_eps_detach_indication_sent | SGS EPS detach indication sent | AGW | MME |
| sgs_eps_detach_timer_expired | SGS EPS Detach Timer expired | AGW | MME |
| sgs_eps_implicit_detach_timer_expired | SGS EPS Implicit detach Timer expired | AGW | MME |
| mme_sgs_imsi_detach_indication_sent | SGS IMSI detach indication sent | AGW | MME |
| sgs_imsi_detach_timer_expired | SGS IMSI detach timer expired | AGW | MME |
| sgs_imsi_implicit_detach_timer_expired | SGS IMSI implicit detach timer expired | AGW | MME |
| mme_spgw_delete_session_rsp | SPGW delete session response | AGW | MME |
| initial_context_setup_failure_received | Initial context setup failure received | AGW | MME |
| nas_service_reject | NAS Service Reject | AGW | MME |
| mme_s6a_update_location_ans | S6a Update location | AGW | MME |
| sgsap_paging_reject | SGS Paging Reject | AGW | MME |
| duplicate_attach_request | Duplicate attach request | AGW | MME |
| authentication_failure | Auth failure | AGW | MME |
| nas_auth_rsp_timer_expired | NAS Auth response timer expired | AGW | MME |
| emm_status_rcvd | EMM status received | AGW | MME |
| emm_status_sent | EMM status sent | AGW | MME |
| nas_security_mode_command_timer_expired | NAS security mode command timer expired | AGW | MME |
| extended_service_request | Extended service request | AGW | MME |
| tracking_area_update_req | Tracking area update request | AGW | MME |
| tracking_area_update | Tracking area update success | AGW | MME |
| service_request | Service request | AGW | MME |
| security_mode_reject_received | Security mode reject received | AGW | MME |
| mme_new_association | New SCTP association | AGW | MME |
| ue_context_release_command_timer_expired | UE context release command timer expired | AGW | MME |
| enb_sctp_shutdown_ue_clean_up_timer_expired | SCTP shutdown UE clean up timer expired | AGW | MME |
| ue_context_release_req | UE context release request | AGW | MME |
| s1ap_error_ind_rcvd | S1AP error indication received | AGW | MME |
| s1_reset_from_enb | S1 reset from eNB | AGW | MME |
| nas_non_delivery_indication_received | NAS non delivery indication received | AGW | MME |
| spgw_create_session | SPGW create session success | AGW | MME |
| ue_pdn_connection | UE PDN connection | AGW | MME |
| ue_pdn_connectivity_req | UE PDN connectivity request | AGW | MME |
| ue_reported_usage / up | Reported TX traffic for subscriber / session in bytes | AGW | sessiond |
| ue_reported_usage / down | Reported RX traffic for subscriber / session in bytes | AGW | sessiond |
| ue_dropped_usage / up | Reported dropped TX traffic for subscriber / session in bytes | AGW | sessiond |
| ue_dropped_usage / down | Reported dropped RX traffic for subscriber / session in bytes | AGW | sessiond |
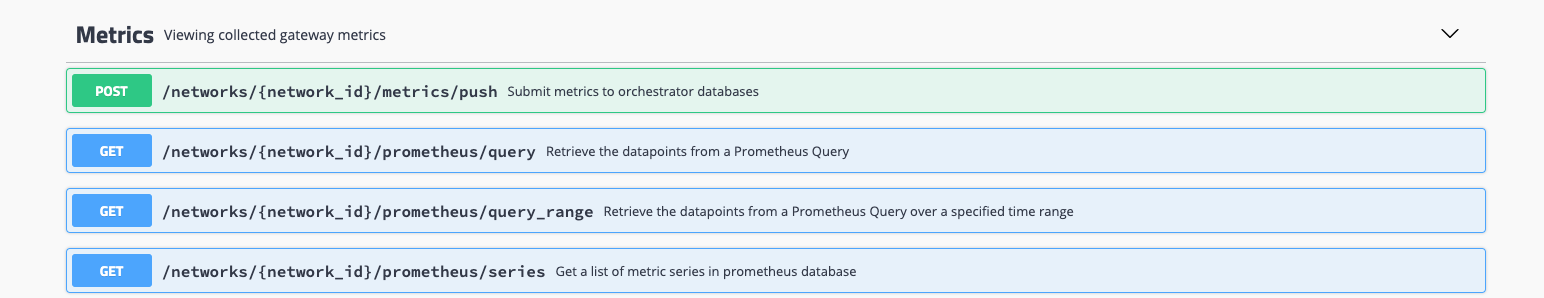
REST API for querying metrics
Troubleshooting Metrics
On the gateways, magmad service collects metrics from all the services and pushes them to Orc8r. In Orc8r, metricsd receives the metrics and pushes them to registered metric exporters. Prometheus is one the main metric exporters. Specifically, Orc8r pushes the metrics to the edge-hub, which later scraped by prometheus instance.
On the query side, When we make queries through NMS or swagger, the Orc8r queries the prometheus instance directly.
We can effectively troubleshoot the metrics by looking at the logs in all these components involved. On the gateways, syslog might have error logs in case there is a failure during metric upload
ERROR:root:Metrics upload error! [StatusCode.UNKNOWN] rpc error: code = Unavailable desc = client_loop: send disconnect: Broken pipe
On the orc8r, we can debug the issues by dumping the logs on prometheus, prometheus-configmanager, prometheus-cache and metricsd
kubectl --namespace orc8r logs -l app.kubernetes.io/component=prometheus-configurer -c prometheus-configurer
kubectl --namespace orc8r logs -l app.kubernetes.io/component=prometheus -c prometheus
kubectl --namespace orc8r logs -l app.kubernetes.io/component=metricsd
helm --debug -n orc8r get values orc8r